
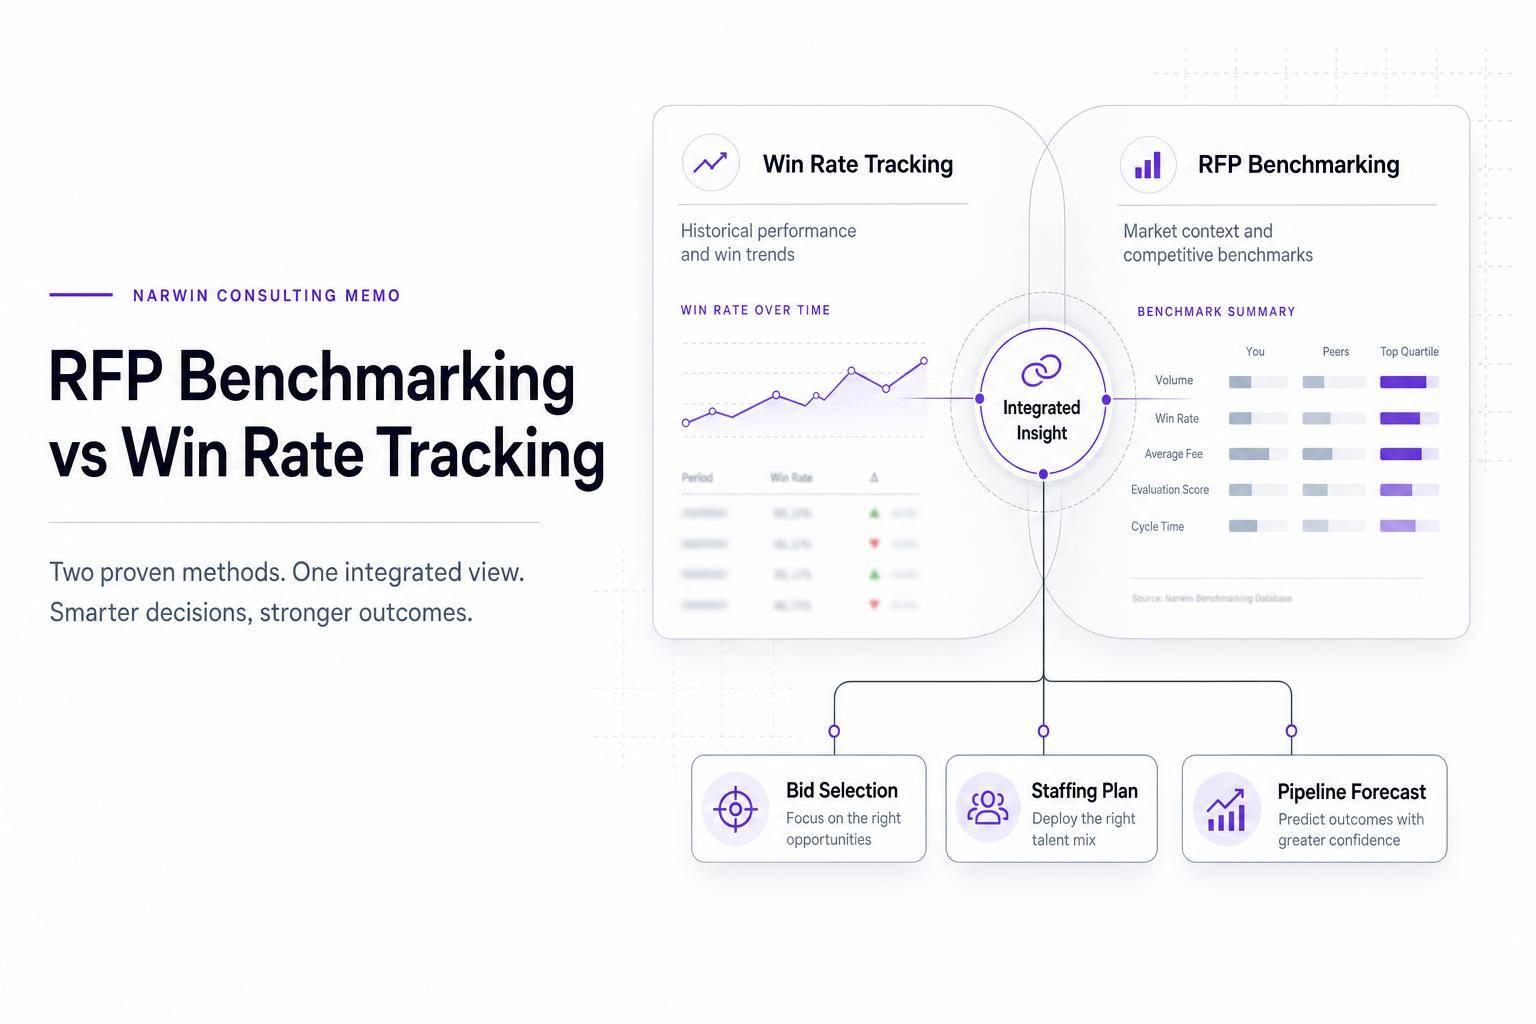
If I had to put it simply: win rate tells me how often I win, while benchmarking shows me where, why, and whether those bids were worth the effort.
If I only track one number like a 25% win rate, I can miss big problems. I might be winning small bids and losing the larger ones. I might do well with city buyers but struggle with federal agencies. And I might spend too much time on low-fit bids that convert at only 10% while better-fit bids convert at 45%.
Here’s the short version:
- Win rate tracking is best for basic reporting and rough revenue math
- RFP benchmarking is best for bid selection, staffing, and segment-by-segment planning
- I should start with win rate first
- Once I have 20–30 closed opportunities, I can add segment tracking
- The main inputs for benchmarking are:
- buyer type
- region
- deal size
- procurement method
- incumbent status
- bid stage
- loss reasons
- effort hours
- margin on wins
That means I do not have to choose one or the other. I use win rate for the top-line view, and benchmarking for better decisions.
Quick comparison
| Criteria | Win Rate Tracking | RFP Benchmarking |
|---|---|---|
| Main question | Are we winning enough? | Where do we win or lose, and what should we change? |
| Main output | One percentage | Segment-level patterns |
| Data needed | Wins, losses, submissions, dates | Tags, outcomes, loss reasons, effort, margin |
| Best use | KPI reporting and rough forecasting | Go/no-bid calls, staffing, and pipeline planning |
| Effort level | Low | Higher |
| What it can miss | Fit, bid quality, and segment performance | Less useful if data is messy |
I see the split like this: win rate reports the score; benchmarking helps me decide what to do next.
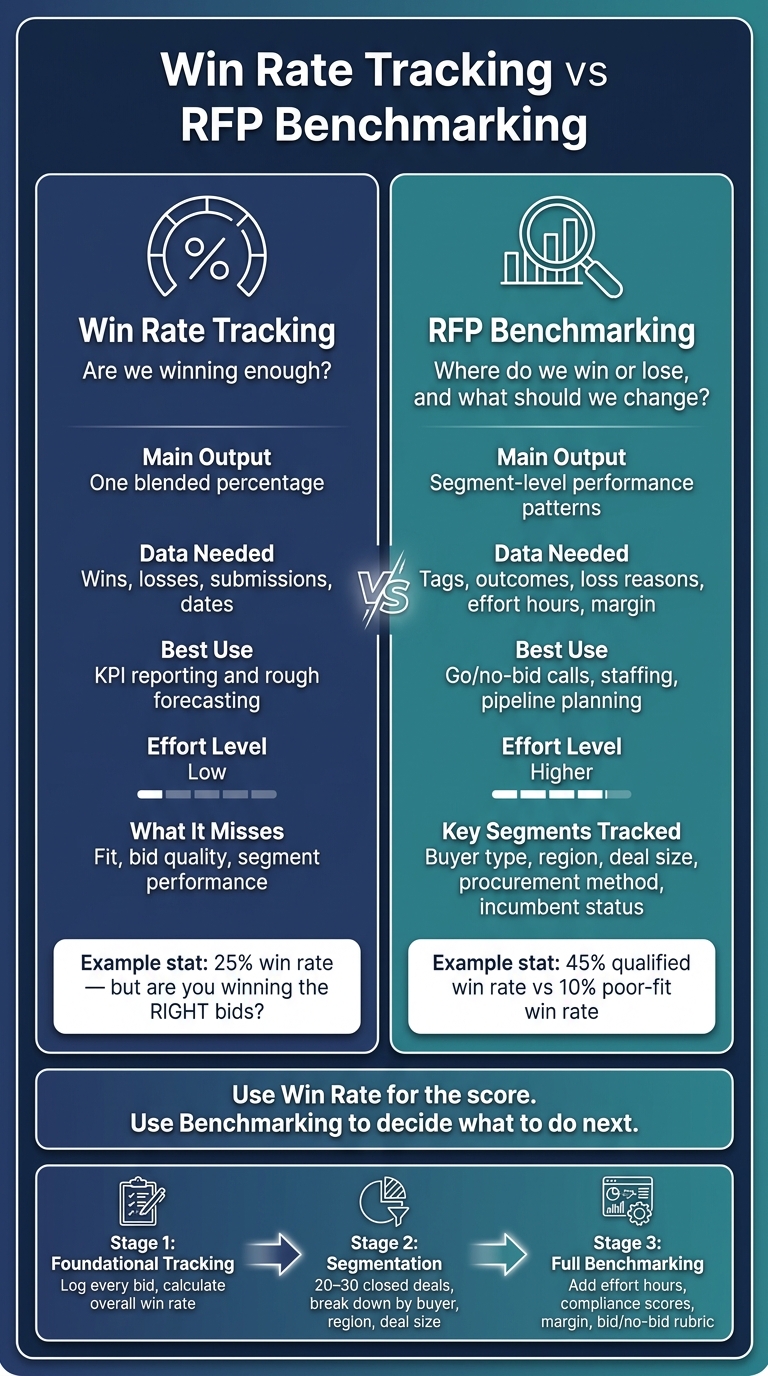
Win Rate Tracking vs RFP Benchmarking: Key Differences at a Glance
Win rate tracking for RFPs
Win rate is the percentage of submitted proposals that turn into wins.
The formula is simple: Win Rate (%) = (RFPs Won ÷ RFPs Submitted) × 100
Say your team submits 40 proposals in Q1 and wins 10. Your win rate is 25%.
Core data needed to calculate win rate
If you want win rate to mean anything over time, track the same fields for every opportunity:
- buyer
- sector
- region
- contract value
- submission date
- outcome
- owner
Use the submission date, not the award date, to set the reporting period. That keeps monthly, quarterly, and annual comparisons clean, even when award decisions take longer than expected.
What win rate shows and what it misses
Win rate is useful for checking trends, doing simple pipeline math, and giving leaders a quick read on performance.
For example, if your win rate is 30% and your average contract value is $500,000, you can estimate how many bids you need in play to hit your revenue goal. That makes win rate a handy planning metric.
But it has limits. It can’t tell you why you lost. Was the issue heavy competition? Weak proposal quality? Bad opportunity selection? Win rate alone won’t answer that.
It also won’t show whether you’re winning smaller bids while losing larger, more important ones. That’s where benchmarking helps. It breaks win rate into segments, so you can see what’s happening beneath the top-line number.
Benchmarking answers those questions by breaking win rate into segments.
RFP benchmarking
Win rate tells you the result. Benchmarking tells you what that result means.
It compares your current RFP performance against your own past results and segment-level benchmarks, so teams can see where bid effort should go. Without that context, win rate is just a top-line number. With it, you can spot where you’re strong, where you’re wasting effort, and where the process is breaking down.
That context comes from a small set of benchmark metrics.
Metrics benchmarking adds beyond raw win rate
Benchmarking adds metrics that show fit, participation, and process quality.
Qualified win rate looks only at wins on opportunities that matched your criteria. For example, a team may win 20% overall but 45% of state health IT opportunities that fit its target profile. That difference tells you a lot. It shows where your best odds are and where your pipeline should lean.
Participation rate shows what share of relevant opportunities you actually went after. If participation is low in a high-yield segment, that’s often a sign of weak market scanning or go/no-bid calls that are too cautious. Shortlist rate measures the share of submitted proposals that move into the competitive range. Even when you don’t win, this metric shows whether your proposals are strong enough to stay alive.
Other metrics help answer three simple questions: Are you pursuing the right deals? Are your proposals strong enough to compete? Is your process wasting time or money?
Those metrics include:
- Bid/no-bid success rate
- Proposal cycle time
- Compliance rate
- Cost per bid
- Margin on wins
Taken together, they can surface low-fit segments, pricing problems, and bottlenecks in the proposal process.
Data needed for useful benchmarks
Useful benchmarking starts with structured loss reasons. That means using standard categories like "price too high", "insufficient past performance," or "incumbent advantage" so you can review trends the same way every time.
You also need steady segment tags on every opportunity. At a minimum, that includes agency type (federal, state, city), region or state, procurement method (RFP, RFQ, IFB, task order), incumbent status, and whether the bid is for a new award or a recompete. These tags let you compare like with like instead of mixing very different deals into the same bucket.
It also helps to log effort hours by role and set clear baseline periods for comparison. Quarter-over-quarter and year-over-year reviews tied to U.S. fiscal cycles – including the federal fiscal year that starts on October 1 – give you trendlines you can actually trust.
Without steady tagging, benchmark results fall apart. With the right inputs, the comparison against win rate becomes much more useful.
sbb-itb-bb3960c
RFP benchmarking vs. win rate tracking: a direct comparison
Win rate tells you whether you’re winning. Benchmarking tells you where you’re winning, where you’re slipping, and why.
That difference matters when you’re deciding where to put proposal time, how to staff the pipeline, or what kind of revenue target makes sense.
Purpose, data inputs, and decision value
Win rate tracking is descriptive. It looks back at results and gives you one percentage. Benchmarking is more diagnostic and planning-focused. It breaks performance down by agency, procurement channel, deal size, incumbent status, and bid stage so you can spot patterns and do something with them.
Here’s how the two approaches differ in practice.
| Feature | Win Rate Tracking | RFP Benchmarking |
|---|---|---|
| Core question | "Are we winning enough?" | "Where are we strong or weak, and what should we change?" |
| Data inputs | Total opportunities, wins, losses, and date range | Opportunity type, deal size, agency, region, procurement channel, bid stage, incumbent status, and outcome |
| Analytical depth | Single outcome metric | Segment-level performance across deal types and geographies |
| Decision value | High-level performance reporting | Go/no-bid discipline, resource allocation, and process improvement |
| Effort to maintain | Low – minimal cleanup needed | Higher – requires consistent tagging and structured tracking over time |
That’s what makes benchmarking useful for proposal planning. It doesn’t just say, “Here’s your number.” It helps explain what’s behind the number.
That gap becomes much more important when you forecast revenue and decide where effort should go.
Pipeline planning impact
Win-rate forecasting blends all past performance into one percentage. Benchmarking splits that history by segment. If your team won 25% of bids last year, a simple forecast would treat 25% of this year’s pipeline as expected revenue. That can work as a rough estimate, but it assumes every opportunity has the same odds.
In practice, that’s almost never true.
Benchmark-based planning starts by segmenting the pipeline. A team might learn that it wins 40% of small local bids, 22% of mid-sized state and local bids, and only 8% of large federal RFPs. When you apply those separate rates to each part of the pipeline, the forecast gets more honest. It also shows where your team should lean in and where it may be burning time.
| Planning aspect | Win rate forecasting | Benchmark-based planning |
|---|---|---|
| Forecast basis | Single blended historical average | Segment-level qualified win rates |
| Prioritization logic | Deal size or submission deadline | Segment strength, qualification quality, and profitability patterns |
| Resource allocation | Reactive – respond to incoming bids | Proactive – prioritize high-probability segments |
| Risk visibility | Minimal until post-award debrief | Built in through go/no-bid scoring and margin tracking |
| Margin focus | Volume of wins | Profitability by opportunity class |
You can see the difference most clearly in go/no-bid decisions. A team that looks only at its overall win rate may keep pursuing low-fit bids because the top-line number seems fine. Segment benchmarks make that problem hard to miss.
For example, a 28% overall win rate might sound decent at first glance. But if that same team has a 45% qualified win rate and poor-fit bids convert at only 10%, the issue isn’t pure execution. It’s bid selection.
That’s the big split between the two methods: win rate tracking tells you the score, while benchmarking shows what’s driving it.
How to use both methods in a practical RFP process
Win rate gives you the baseline. Benchmarking adds the detail you need to plan better. Most proposal teams don’t have to pick one or the other. They need to know when to use each method and how to build toward both without making the process harder than it needs to be.
A simple maturity path for proposal teams
Start with win rate. Then layer in benchmarking once segment-level trends start to matter. The simplest path is staged: begin with the basics, then add more detail as your data set grows.
- Stage 1 – Foundational tracking: Log every submitted bid in one tracking system. Include the buyer, submission date, value, status, and decision date. Use one clear definition of a submitted bid, keep records clean, and calculate your overall win rate. That gives you a dependable baseline KPI and something concrete to share with leadership.
- Stage 2 – Segmentation: Once you have at least 20–30 closed opportunities, break win rate down by deal type, buyer type, region, and contract size. Trends usually start to show up here. You may notice that certain buyer types convert better, or that one region performs worse than expected. Once those patterns are clear, add effort and quality data to help explain them.
- Stage 3 – Full benchmarking: Add effort data like hours spent by role, team roles, compliance scores, margin expectations, and whether a bid/no-bid review was completed. This is the point where benchmarking starts shaping staffing and bid selection. A structured bid/no-bid rubric can cut low-fit pursuits and push effort toward better opportunities.
These inputs make staffing, forecasting, and go/no-bid calls easier to handle. Staffing gets simpler when you know that winning a typical SAM.gov IT opportunity calls for certain roles. Revenue forecasts get sharper when each opportunity has a segment-specific win probability instead of one blended average. And performance reviews can shift away from “Why did we lose this?” to “Was this ever a likely win in the first place?”
Where Narwin.ai fits
Benchmarking only works if your opportunity data is complete and consistent. Narwin.ai supports that workflow by monitoring major federal, provincial, and city bid sources in the U.S. and Canada and turning opportunities into win scores, risk flags, and go/no-go guidance.
Those scores can sit alongside actual outcomes, so you can compare predicted performance with actual performance over time and tighten your benchmarks with each new cycle. Because Narwin integrates with Google Drive, Slack, and major CRMs and ERPs, opportunity data, outcomes, and resource usage can flow into your tracking system automatically. That cuts down on the manual work that often makes benchmarking feel like a chore.
Conclusion: Use win rate for baseline reporting and benchmarking for better planning
Win rate is where every proposal team should start. It’s simple, defensible, and easy to report. But it only tells you the score. Benchmarking shows you what’s behind that score – and what should change.
The strongest RFP teams use both. Win rate gives them a steady KPI. Benchmarking gives them segment-level insight to pursue better-fit opportunities, staff pursuits with more intent, and build forecasts that reflect how different parts of the pipeline actually perform. Together, they make proposal planning more disciplined.
FAQs
When should I move beyond win rate?
Move past simple win rate tracking when you need a fact-based way to improve resource allocation. Win rate helps you review past results, but it’s a lagging metric. It also doesn’t show the specific complexity of new opportunities.
This shift helps most when proposal costs are high, bid quality varies, or it’s tough to rank several tenders at once. Tools like Narwin.ai support proactive go/no-go decisions with win scoring based on fit, risk, and competitive advantage.
What data matters most for benchmarking?
The most useful benchmarking data pulls from both structured and unstructured inputs tied to past RFP work.
That usually includes proposal archives, past performance reviews, CPARS ratings, debrief notes, and win/loss labels. Put simply, you want both the hard numbers and the messy context. The numbers show patterns. The notes and reviews show why those patterns happened.
Pricing trends, contract sizes, agency spending habits, NAICS codes, set-aside status, and certification requirements matter too. They help teams measure performance patterns, strategic fit, and compliance accuracy with a lot more precision.
How can benchmarking improve go/no-bid decisions?
Benchmarking helps teams make better go/no-bid decisions by swapping gut feel for an evidence-based process.
When teams look at standardized historical data – like past proposals, performance reviews, and win/loss patterns – they can see what’s working, where risks keep showing up, and which client profiles tend to be the best fit.
That makes it easier to judge new RFPs with more objectivity, catch compliance gaps and operational risks early, and rule out poor-fit opportunities before spending major time and resources.